How to Build a Multi Race Dashboard Using Greyhound Racing API
December 22, 2025
9 min read

Dog racing moves quickly with multiple races happening in just minutes across different tracks. This can make it hard for bettors, analysts, and fans to keep up. Using single pages or switching tabs often leads to missed opportunities and incomplete data. That’s why having everything in one place is so important.
A multi-race dashboard makes it easy for users to access racing data by combining live feeds, performance stats, and betting odds all in one place. It acts as a control center where users can see and use the information easily. To build this kind of tool, developers need a reliable data source like the Greyhound Racing API, which is key to making it work.
In this guide, we’ll walk through the key steps to build a multi-race dashboard using a Greyhound Racing API. From understanding the API’s capabilities to designing a user-friendly interface that supports real-time data updates, this walkthrough provides a clear roadmap.
Whether you’re working on a personal betting project or developing commercial greyhound racing software, these insights will help you get started efficiently.
What is Greyhound Racing API?
A greyhound racing API provides programmatic access to race data, delivering real-time and historical information in formats like JSON or XML. It eliminates the need for manual scraping or relying on fragmented sources, offering consistent and structured data.
Most greyhound racing APIs provide information on race schedules, dog profiles, track details, race results, and betting odds. Developers can use this information to build apps, dashboards, and other tools that automatically update in real time.
The Greyhound Data API helps developers save time by providing accurate, reliable data, so they can focus on building useful features. This is especially helpful during multiple races happening at once, where speed and consistency are critical.
Why Build a Multi Race Dashboard?
Tracking one race manually might be simple, but following several races at once can quickly become overwhelming. You have to keep up with schedules, rankings, and performance updates all at the same time, which can be time-consuming.
A centralized dashboard solves this problem by putting all the important information in one place. With everything organized clearly, it’s much easier to keep track of every race without missing anything important.
Here are some key reasons to build a multi-race dashboard:
- Efficiency: Monitor multiple races at once without switching platforms.
- Data comparison: Analyze patterns across different races, tracks, and competitors.
- Decision support: Get faster, data-driven insights.
- Scalability: Easily expand to cover more races and regions.
For professionals working with dogs greyhound racing, a unified dashboard reduces cognitive load by bringing all race data into one clear view. Instead of switching between multiple sources, users can track performance metrics, race timelines, and results side by side, enabling faster understanding and more efficient monitoring.
Adding Real-Time Updates and Advanced Features
Real-time updates give users the latest data for quicker, better-informed decisions. Advanced tools enable deeper analysis and customization, making your dashboard a dynamic, essential resource for various needs.
Live Data Updates
WebSockets and server-sent events are powerful tools that enable continuous data streaming, eliminating the need for manual refreshes. This ensures that information, such as live race updates, remains both current and reliable in real-time.
By maintaining an uninterrupted flow of data, these technologies enhance user experience and provide seamless access to the most up-to-date details, making them ideal for scenarios where timely and accurate information is critical.
Filtering and Sorting
filter races based on track location, race time, or specific performance metrics, giving them the flexibility to find exactly what they are looking for. These filtering options make it easier to narrow down choices, while sorting tools help users quickly prioritize the most relevant races.
For example, users can sort by fastest lap times, upcoming schedules, or even specific track conditions, ensuring they can focus on races that best match their interests and needs.
Predictive Insights
Advanced dashboards can make the user experience even better by adding predictive models. These models look at past race results, market trends, and Greyhound Race Odds Data to offer insights that are much deeper than basic stats.
By using all this information, the dashboard can predict possible race outcomes, giving users a more analytical perspective on the sport.
Key Features of Greyhound Racing API
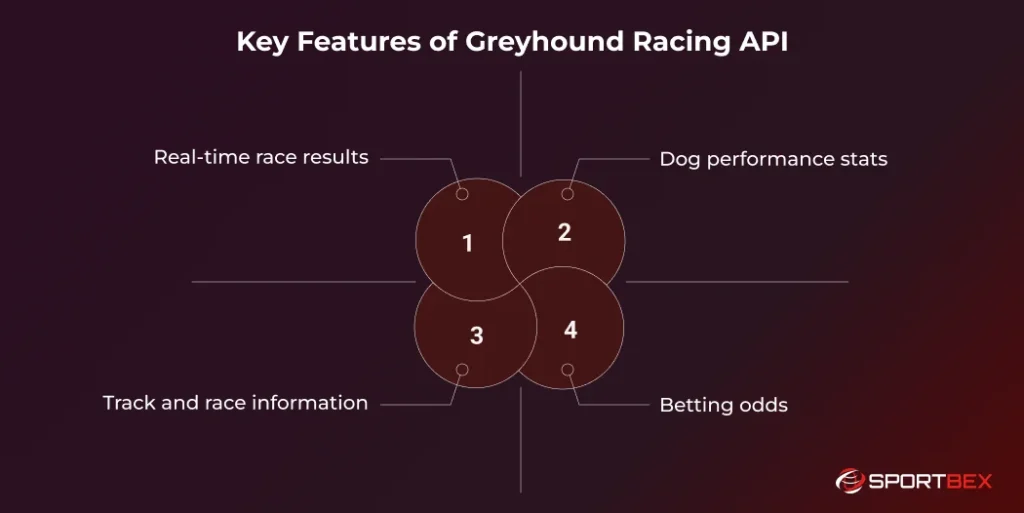
A great dashboard relies on using data effectively. Here are the key API-driven features and how they improve a multi-race dashboard.
Real-Time Race Results
Live race updates are the foundation of any racing dashboard. They provide real-time results, allowing users to monitor a race’s progress from start to finish as it happens. This functionality lets them instantly view finishing positions and identify race outcomes without delay.
This data is delivered to the dashboard through frequent API polling or advanced streaming. This ensures the information is always current, which is essential for dashboards that prioritize live tracking.
Greyhound Racing Data, Made Simple
Easily add live race results and dog profiles to your website or project.
Dog Performance Stats
Performance metrics offer valuable insights beyond race results, providing a detailed understanding of a dog’s abilities. These metrics might include past race finishes, speed ratings, consistency indicators, and recent form history.
Analyzing performance data across races is key to spotting patterns. This approach helps identify consistent top performers or declining trends in a dog’s performance over time. It enables more informed decisions than relying on finishing positions alone.
Track and Race Information
Track conditions, race distances, locations, and schedules are key to analyzing performance, as they reveal how external factors impact outcomes. A well-designed dashboard organizes this data, allowing quick comparisons of race details across venues.
For instance, users can compare track conditions between races or spot patterns in performance under different weather or track types. This context is crucial for evaluating consistency and adaptability across various environments.
Betting Odds
Betting odds are key to racing analysis, reflecting market sentiment and probability modeling. When integrated into a dashboard, they enhance analytical depth and enable advanced comparisons between competitors.
Direct access to comprehensive Greyhound Racing Odds allows the dashboard to present critical information like pricing changes and pre-race expectations in a clear, structured format. This enables users to see the story behind the odds, not just the numbers themselves.
Fetching and Managing Racing Data
The core of your dashboard is the data fetching layer, where you connect to the Greyhound Racing API to retrieve user information.
API Integration
Secure authentication and effective rate-limit handling are critical for a reliable system. Your platform must gracefully manage request limits and error responses to maintain stability, user trust, and data freshness. Implementing clear error messages and retry mechanisms, for example, can improve the user experience when API limits are reached.
The Greyhound Racing API serves as the main data source, delivering structured, up-to-date race information. It ensures your application has the key details for seamless integration and a smooth user experience based on accurate data.
Data Normalization
Racing data often comes from various endpoints, each with its own format and structure. By normalizing this data into consistent formats, it becomes much easier to filter, sort, and compare details across different races.
This process ensures that no matter how varied the original sources might be, the information can be analyzed more effectively, enabling smoother insights and more accurate comparisons.
Storage Strategy
Storing historical results on a local database significantly enhances the performance and responsiveness of your application. This local storage allows for more complex and deeper analysis of the data without the need to make repeated, and often slow, API calls to external sources.
This approach is particularly advantageous when you are dealing with large volumes of Greyhound Racing Data that have been collected over an extended period, as it reduces latency and provides more immediate access for querying and data manipulation.
Designing the Dashboard User Interface
The success of your greyhound racing software depends heavily on how interpretable the data is. A cluttered screen leads to cognitive overload.
Layout and Structure
A grid-based layout is an effective way to structure the dashboard, enabling side-by-side race comparisons. Use components like cards, tables, and panels to organize complex data clearly. This modular design prevents the interface from feeling cluttered or overwhelming.
Data Visualization
Charts and graphs are excellent for transforming raw numbers into more easily understandable and meaningful insights. By visualizing trends and data points, you can make it much easier for users to compare different races at a glance and quickly identify important patterns that might be hidden in spreadsheets or tables.
Responsive Design
Ensure the interface works seamlessly on all devices. With many users accessing dashboards on tablets or mobile screens, responsiveness is key to maintaining a consistent, user-friendly experience. An optimized interface ensures smooth navigation, readability, and functionality.
Planning Your Multi-Race Dashboard
A clear plan ensures your dashboard remains scalable, maintainable, and aligned with user needs. Planning now reduces future issues and supports long-term success.
- Define Your Goals: Start by defining the dashboard’s purpose and audience. Identify who will use it, whether it’s for live race monitoring, historical analysis, or both, and decide how many races to display at once. Clear goals help prioritize key features while allowing for future upgrades.
- Choose the Right Technology Stack: A modern multi-race dashboard often uses dynamic frontend frameworks like React, Vue, or Angular, with a Node.js or Python backend for API communication. Databases like PostgreSQL or MongoDB handle data storage. Choosing the right stack ensures your Greyhound Racing Software processes high-frequency updates efficiently.
- Design for Scalability: Scalability should be a priority from the start of the project. Even if the initial software only supports a few races, the architecture must be designed to handle future growth. This ensures the system can easily accommodate more tracks, new data streams, and more users without costly redesigns.
Conclusion
Building a multi race dashboard is more than just a technical task. It is a smart way to understand and manage complex racing data. By bringing race schedules, performance metrics, track details, and odds into one interface, users can make faster and better decisions with confidence.
we explained how structured data, proper planning, and modern interface design work together to create an effective racing solution. From learning how APIs work and organizing data to adding real time updates and advanced analytics, each step plays an important role in building a reliable dashboard.
As interest in intelligent sports platforms continues to grow, dashboards powered by accurate data will shape the future of racing technology. Whether you are studying trends, developing professional tools, or exploring opportunities in Greyhound Betting, a well designed dashboard offers the clarity and speed needed to stay ahead.
Live Data from Top Greyhound Tracks
Integrate the fastest, most reliable live odds and race data into your platform.
Frequently Asked Questions
A multi race dashboard is a single interface that displays information from multiple greyhound races at the same time. It helps users track race schedules, dog performance, results, and other key data without switching between different platforms.
A Greyhound Racing API provides structured and reliable race data in real time. Using an API saves development time, ensures data accuracy, and makes it easier to manage live updates and historical information in one system.
Yes, a properly designed dashboard can handle real time updates using techniques like polling or live data connections. This allows race results, timings, and status changes to appear instantly for users.
Greyhound racing analysts, software developers, data teams, and betting professionals can all benefit. It is also useful for enthusiasts who want a clear and organized way to follow multiple races.
Yes, beginners can build a basic dashboard by starting with simple features and expanding over time. With proper planning, clear goals, and the right tools, even small projects can grow into advanced racing platforms.
Recent Blog


Can Horse Racing Live Feed Handle High-Speed Race Updates?
July 20, 2026

Top 10 Best Indian Football Players Of All Time
June 1, 2026