How to Use Greyhound Racing Data to Create Performance Insights
December 11, 2025
9 min read
Greyhound racing has become a data-driven sport where analyzing past performance is key. Looking at historical data can help trainers, bettors, and fans make informed predictions rather than simply guessing.
By leveraging greyhound racing data and tools like a greyhound data API, you can gain critical insights into individual dog performance, identify track trends, and understand overall race dynamics. This comprehensive approach transforms raw information into actionable knowledge, offering a strategic edge
Mastering data analysis is essential for anyone looking to deepen their understanding and improve their success in this competitive sport, allowing for more strategic and well-founded decisions on race day.
This guide will help you understand how to use greyhound racing data to create performance insights, including the types of data, key metrics to track, where to find reliable sources, and how to analyze it. You’ll learn how to transform raw racing information into actionable insights about greyhound performance.
Understanding Greyhound Racing Data
Greyhound racing data is information that records every aspect of a race and the performance of the dogs. Think of each data point as a piece of a larger puzzle. A single piece, such as a dog’s finishing time, is useful. But when it is combined with other pieces like track conditions, trap number, and past performance, a clearer picture of the dog’s abilities emerges. Effective analysis means putting this puzzle together to understand the full story.
Greyhound data analysis is all about looking at information like a dog’s past races, the track conditions, and other details to spot trends. These trends can help you predict how a dog might perform in the future. By turning these numbers into useful greyhound performance insights, you can get better at predicting race outcomes and understand the sport more.
Types of Greyhound Racing Data
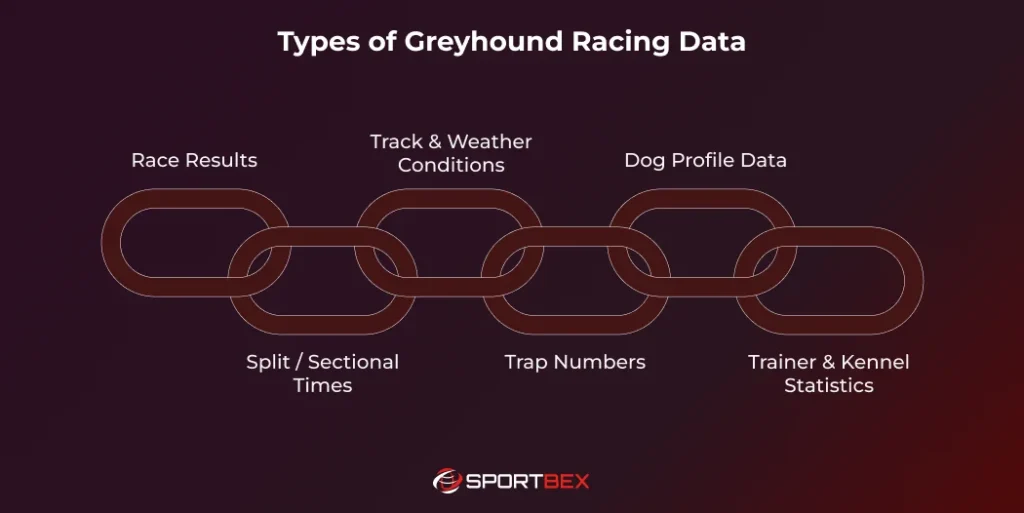
Accurate analysis requires various types of racing greyhound data, each providing unique insights for a complete understanding of performance.
Race Results
Race results show the finishing order of greyhounds in past events, giving a direct measure of their performance. While seemingly straightforward, this data is essential for assessing consistency, competitiveness, and speed.
Analyzing race results over time can reveal valuable patterns, such as steady improvement, a sudden performance decline, or consistent placings, all of which are crucial for informed predictions.
Split / Sectional Times
Split times track how quickly a greyhound runs different parts of a racecourse, helping to analyze early pace, break speed, and finishing strength. Trainers and bettors use these timings to identify a greyhound’s strengths or weaknesses in specific sections of a race.
For instance, a dog with strong early pace may lead quickly, while one with better finishing times can close gaps in the final stretch. These metrics provide valuable insights into a greyhound’s strategy and performance, making split times essential in greyhound racing.
Track & Weather Conditions
Track and weather conditions at different Greyhound Racing Tracks, such as wet or dry surfaces, wind, rain, and temperature, can greatly impact greyhound performance. Some dogs excel on firm, dry tracks with better speed and traction, while others thrive on wet tracks that require more agility.
Analyzing past performance under different conditions offers valuable insights into how a greyhound may perform in specific environments. Understanding these preferences can help predict race outcomes and identify ideal conditions for each greyhound.
Trap Numbers
Trap positions in greyhound racing can greatly impact the outcome. A dog’s starting box can either aid or hinder its performance. Some traps offer a more direct path, benefiting dogs with quick starts, while others suit slower starters with strong finishing speed.
Analyzing historical race data can reveal trap biases at specific tracks, such as whether inside or outside traps produce more winners, giving you a valuable edge in your analysis.
Dog Profile Data
Each dog’s profile offers a detailed look into factors like their age, breed, weight, past injury history, and typical running style. This information is crucial for better understanding their overall performance patterns, stamina levels over different distances, and how quickly they recover between races.
When you combine these individual dog profile details with broader Greyhound racing statistics, your analysis gains a deeper layer of context, leading to more accurate and reliable insights.
Trainer & Kennel Statistics
Trainers and kennels play a vital role in shaping a greyhound’s performance and preparing them for racing. Training methods, kennel environments, and track records can greatly influence a dog’s success.
The historical success rates of trainers and kennels, along with their training techniques, reveal patterns that explain why some greyhounds thrive under specific conditions. This deeper analysis, when combined with Greyhound Racing Odds, adds valuable context to performance statistics, making greyhound racing data analysis more insightful.
Best Sources to Collect Accurate Greyhound Racing Data
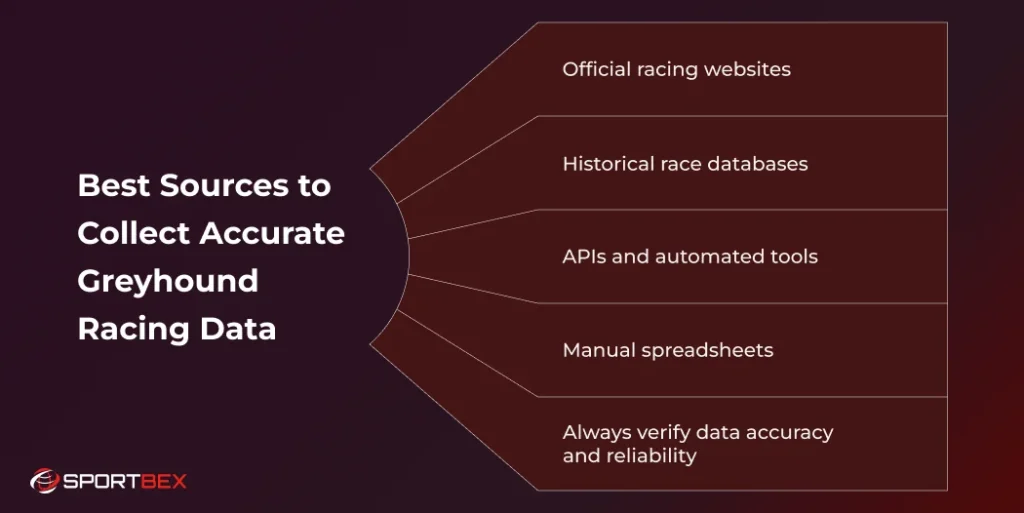
The quality of your analysis depends directly on your data’s quality. Inaccurate or incomplete data will lead to flawed conclusions. Here are the most reliable sources for gathering greyhound racing data.
Official Racing Websites
Official race organizations are a reliable source for verified results, detailed timing, and historical data. These platforms ensure accuracy for both current and past events. They offer valuable insights for those looking to track performance, compare standings, or stay informed about their favorite events.
Historical Race Databases
Specialized databases collect years of racing information like race results, trap numbers, and sectional times. This data helps you spot trends, track performance, and make smarter decisions. For example, sectional times show how fast a greyhound starts, and trap numbers reveal position patterns.
Greyhound Racing Data, Made Simple
Easily add live race results and dog profiles to your website or project.
APIs and Automated Tools
The Greyhound Data API streamlines real-time data collection, automates analysis, and simplifies workflows. It integrates seamlessly with prediction models and other analytics platforms. Paired with the Greyhound Odds API, it offers more detailed insights for smarter betting or performance analysis.
Manual Spreadsheets
A manual spreadsheet is an excellent way to grasp data management fundamentals. You can input data from official sources for specific dogs and tracks. Although this method is time-consuming, the hands-on approach helps you engage deeply with the data and understand the relationships between different variables.
Essential Metrics for Measuring Greyhound Performance
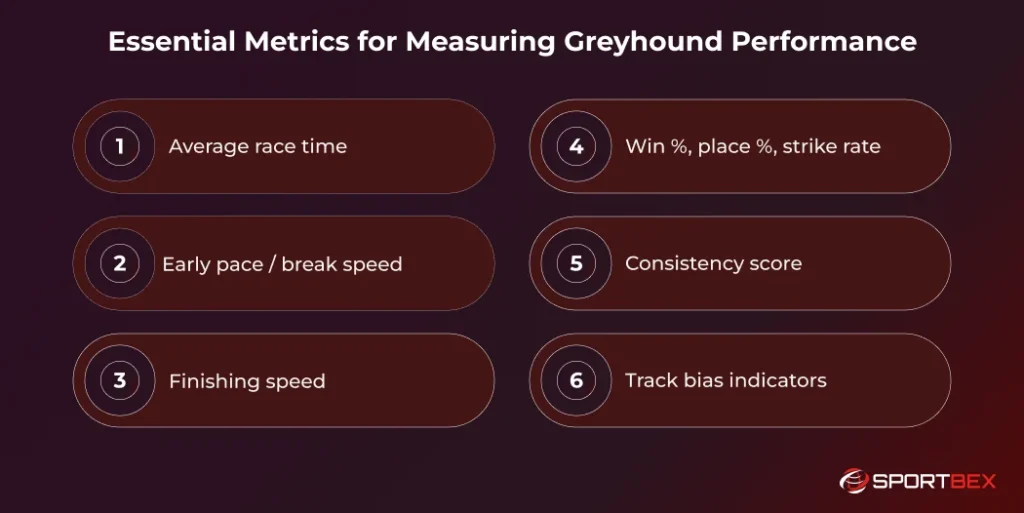
Looking at racing greyhound data means keeping track of different numbers and stats. Some of the most important ones are:
Average Race Time
This metric indicates a greyhound’s general speed and consistency. Calculating the average time it takes for a dog to finish a race establishes a performance baseline. Comparing these times across different tracks and conditions can also reveal specific strengths and weaknesses, like whether a dog performs better on certain surfaces or in particular weather. This approach is commonly used across many dog sports to evaluate overall performance.
Early Pace / Break Speed
A greyhound’s quick start is crucial for success in fast-paced races. A strong start gives them an early lead and a strategic position ahead of competitors, especially in short-distance races where there’s little time to recover from a slow start. Greyhounds with early speed also avoid crowding or interference, increasing their chances of victory.
Finishing Speed
Finishing speed is an important measure of a dog’s stamina and ability to keep moving strongly during the final part of a race. This trait can often decide close contests. When combined with early pace, which shows how quickly a dog starts and gains position, finishing speed gives a complete view of the dog’s racing strategy, from its initial burst of energy to its endurance at the finish.
Win %, Place %, Strike Rate
These statistics provide insight into a dog’s past performance and future potential. A high win percentage shows a dog that often finishes first, while a strong place percentage (finishing in the top two or three) suggests consistent contention. The strike rate, covering a broader range of successful outcomes, is a reliable indicator of the dog’s overall dependability on the track.
Consistency Score
A consistency score combines key performance metrics to evaluate how reliably a greyhound meets or exceeds expectations in its races. This score provides valuable greyhound performance insights by highlighting patterns over time. By analyzing consistency, bettors, trainers, and analysts can better understand a greyhound’s reliability under different conditions
Track Bias Indicators
Some tracks are built in ways that can give certain runners an advantage. For example, the shape of a curve or the type of surface might help runners who are fast at the start or those starting on the inside. Knowing these track differences is important because it helps trainers and bettors plan better for races, especially when using tools like a Greyhound Betting API to access real-time data and odds for smarter decision-making.
Analytical Techniques to Generate Performance Insights
Once you’ve collected your data and calculated key metrics, you can start analyzing it to uncover useful greyhound performance insights.
A great way to start is by making comparisons. You can track a single dog’s performance over time to see if it’s improving or declining. You can also compare a dog to its competitors in an upcoming race to spot any advantages. Looking at trainer statistics can help identify who’s currently in the best form.
For a deeper analysis, you can use regression analysis. This method helps you understand how different factors, like trap number, track conditions, or recent times, affect a dog’s performance. It can even help predict a dog’s finishing time by showing how much each factor matters.
Another useful tool is creating a rating system or “power score” for each greyhound. This involves assigning points for things like recent form, speed, trainer stats, and trap draw. Adding up these points gives each dog a score, which you can use to rank them and find the strongest contenders. Building this kind of system is the ultimate goal of greyhound racing data analysis.
Conclusion
Analyzing greyhound racing data effectively can transform raw race results into actionable greyhound performance insights. By understanding different types of data, using reliable sources, tracking essential metrics, and applying analytical techniques, you can make informed decisions for training, betting, or general race predictions.
The process starts with thorough data collection from trusted sources such as official racing websites, Greyhound Racing API, or manual spreadsheets. Once the data is organized, metrics like average race time, early pace, finishing speed, win rates, and consistency form the foundation for meaningful insights. Analytical techniques, including comparative and trend analysis as well as predictive modeling, help refine the evaluation further.
Live Data from Top Greyhound Tracks
Integrate the fastest, most reliable live odds and race data into your platform.
Frequently Asked Questions
Analyzing greyhound racing data analysis allows you to identify patterns, evaluate performance metrics, and make informed decisions for training, betting, or race predictions. It turns raw race results into meaningful insights.
Essential types of data include race results, split or sectional times, track and weather conditions, trap numbers, dog profile data, and trainer or kennel statistics. These data points collectively provide a full picture of a dog’s performance.
Reliable sources include official racing websites, historical race databases, Greyhound Racing API, and well-maintained manual spreadsheets. Always verify the accuracy of data before using it for analysis.
Key metrics include average race time, early pace, finishing speed, win and place percentages, strike rate, and consistency scores. Tracking these metrics helps generate accurate greyhound performance insights.
By collecting accurate data, tracking essential metrics, and applying analytical techniques like trend analysis and predictive modeling, you can identify strong performers, understand track biases, and optimize race strategies for both training and betting purposes.
Recent Blog


Why You Need a Cricket API for IPL 2026 for Developers and Businesses?
March 27, 2026

Which API Horse Racing Offers Global Race Coverage?
March 24, 2026